![The States That Drink the Most Beer in America [Map]](https://vpstats.vinepair.com/wp-content/uploads/2020/05/beermap_card-375x450.jpg "The States That Drink the Most Beer in America [Map]")
America reportedly drinks about 6.3 billion gallons of beer every year. But which states drink the most? According to data from the National Institute on Alcohol Abuse and Alcoholism, beer consumption per capita varies significantly by state and region.
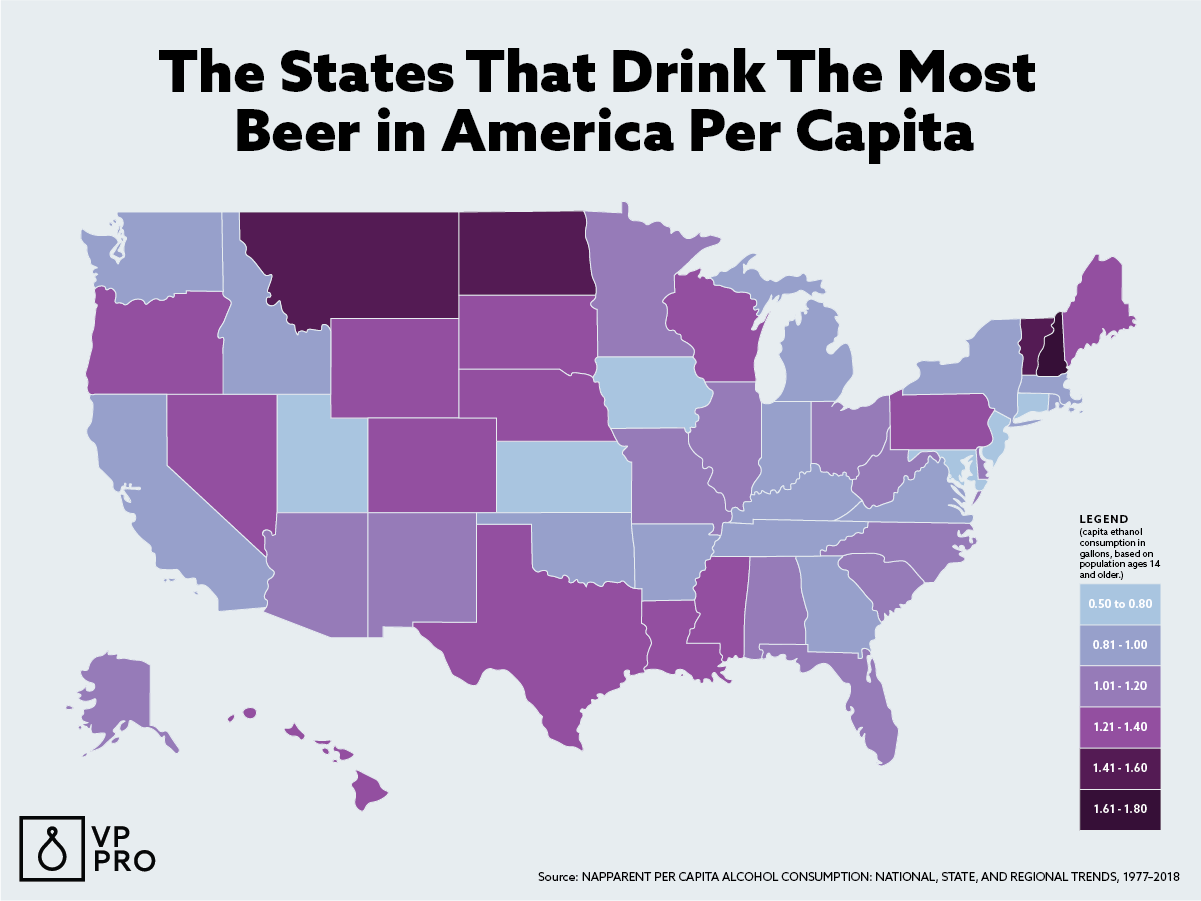
Midwesterners drink more beer than those in other regions, while Northeasterners drink the least. However, New Hampshire residents drink by far the most beer per capita of any state — likely due to the state’s unique lack of tax on alcohol. Meanwhile, Utah unsurprisingly drinks the least amount of beer per capita, as the predominantly Mormon state largely abstains from alcohol.
VinePair’s color-coded maps show these and other results of American beer consumption in 2018.
THE STATES THAT DRINK THE MOST BEER PER CAPITA
After New Hampshire, the states that claim the most beer drinking per capita are Montana, Vermont, and North Dakota.
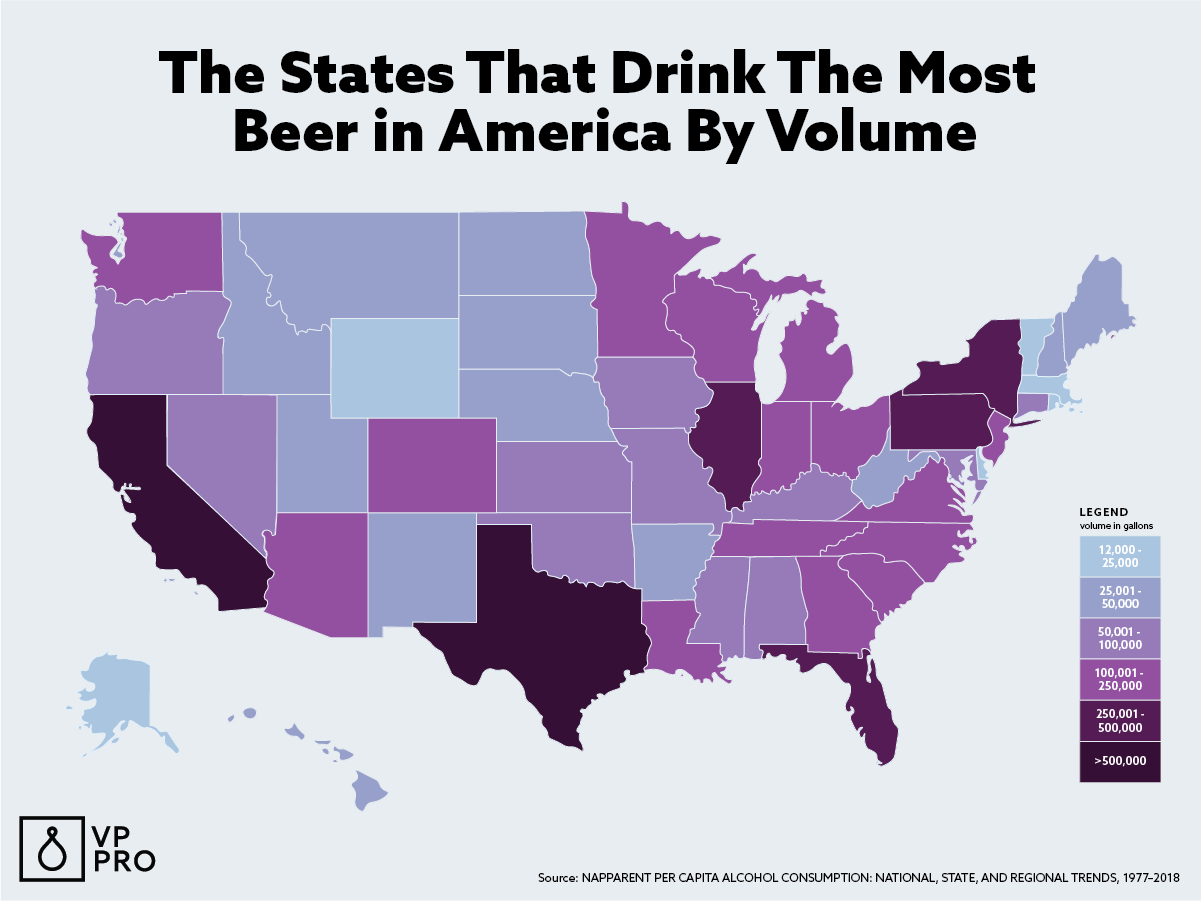
THE STATES THAT DRINK THE MOST BEER OVERALL
Unsurprisingly, highly populated states such as California, Texas, and Florida top the list of states drinking the most beer overall — with Illinois, Pennsylvania, and New York trailing behind.
Ranking The States
| Rank | State | Gallons of Ethanol Per Capita* |
|---|---|---|
| 1 | New Hampshire | 1.79 |
| 2 | Montana | 1.6 |
| 3 | Vermont | 1.53 |
| 4 | North Dakota | 1.50 |
| 5 | South Dakota | 1.37 |
| 6 | Nevada | 1.35 |
| 7 | Maine | 1.34 |
| 8 | Wisconsin | 1.29 |
| 8 | Pennsylvania | 1.29 |
| 10 | Hawaii | 1.28 |
| 11 | Iowa | 1.24 |
| 12 | Louisiana | 1.23 |
| 13 | Nebraska | 1.22 |
| 13 | Wyoming | 1.22 |
| 15 | Mississippi | 1.21 |
| 15 | Oregon | 1.21 |
| 15 | Texas | 1.21 |
| 18 | West Virginia | 1.15 |
| 19 | Colorado | 1.14 |
| 19 | Minnesota | 1.14 |
| 21 | Delaware | 1.11 |
| 21 | Missouri | 1.11 |
| 21 | South Carolina | 1.11 |
| 24 | Ohio | 1.10 |
| 25 | Arizona | 1.08 |
| 25 | Dist. Of Columb. | 1.08 |
| 25 | Illinois | 1.08 |
| 28 | New Mexico | 1.07 |
| 29 | Alaska | 1.06 |
| 30 | Florida | 1.05 |
| 31 | Alabama | 1.04 |
| 31 | North Carolina | 1.04 |
| 33 | California | 1.00 |
| 33 | Michigan | 1.00 |
| 33 | Oklahoma | 1.00 |
| 36 | Kansas | 0.99 |
| 37 | Tennessee | 0.98 |
| 38 | Indiana | 0.96 |
| 39 | Georgia | 0.95 |
| 40 | Virginia | 0.94 |
| 41 | Kentucky | 0.93 |
| 42 | Massachusetts | 0.91 |
| 42 | Washington | 0.91 |
| 44 | Arkansas | 0.90 |
| 44 | Idaho | 0.90 |
| 44 | Rhode Island | 0.90 |
| 47 | New York | 0.88 |
| 48 | Connecticut | 0.80 |
| 48 | New Jersey | 0.80 |
| 50 | Maryland | 0.78 |
| 51 | Utah | 0.58 |
Looking at things from the perspective of total gallons of beer consumed, the data largely mirrors population ranks.
| Rank | State | Gallons Overall |
|---|---|---|
| 1 | California | 727.3M |
| 2 | Texas | 618.1M |
| 3 | Florida | 420.1M |
| 4 | New York | 321.1M |
| 5 | Pennsylvania | 307.9M |
| 6 | Illinois | 253.4M |
| 7 | Ohio | 237M |
| 8 | North Carolina | 198.2M |
| 9 | Michigan | 186.2M |
| 10 | Georgia | 181.6M |
| 11 | Virginia | 148.2M |
| 12 | Arizona | 141.4M |
| 13 | Wisconsin | 138.8M |
| 14 | New Jersey | 132M |
| 15 | Washington | 125.6M |
| 16 | Missouri | 124.4M |
| 17 | Tennessee | 122.4M |
| 18 | Colorado | 119.3M |
| 19 | Massachusetts | 118.7M |
| 20 | Indiana | 117M |
| 21 | Minnesota | 116.3M |
| 22 | South Carolina | 103.9M |
| 23 | Louisiana | 103.7M |
| 24 | Oregon | 94.4M |
| 25 | Alabama | 93.4M |
| 26 | Maryland | 86.7M |
| 27 | Kentucky | 76.2M |
| 28 | Nevada | 75.2M |
| 29 | Iowa | 71.6M |
| 30 | Oklahoma | 71.2M |
| 31 | Mississippi | 65.6M |
| 32 | Connecticut | 53.5M |
| 33 | Kansas | 51.8M |
| 34 | Arkansas | 49.3M |
| 35 | New Hampshire | 46.3M |
| 36 | Nebraska | 42.1M |
| 37 | New Mexico | 40.8M |
| 38 | West Virginia | 39.1M |
| 39 | Maine | 34.1M |
| 40 | Hawaii | 33.6M |
| 41 | Montana | 31.5M |
| 42 | Utah | 31.3M |
| 43 | Idaho | 28.1M |
| 44 | South Dakota | 21.7M |
| 45 | North Dakota | 20.6M |
| 46 | Delaware | 20M |
| 47 | Vermont | 18.3M |
| 48 | Rhode Island | 18.1M |
| 49 | Dist. of Columb. | 14.3M |
| 50 | Alaska | 14M |
| 51 | Wyoming | 12.8M |
*This data uses an estimate of average ethanol content of sold or shipped beer into gallons of ethanol (pure alcohol) before calculating per capita consumption estimates. For this data, the alcohol by volume value for beer is 0.045.
This story is a part of VP Pro, our free platform and newsletter for drinks industry professionals, covering wine, beer, liquor, and beyond. Sign up for VP Pro now!